The NOVARegion dashboard is Northern Virginia Regional Commission’s dashboard containing a plentiful amount of demographic, military, and environmental information and interactive charts. It has been updated to reflect the most current demographic data on population, education, and income. NVRC highly recommends that you to take a look because the demographic transformations of Northern Virginia will come to light with all the eye-catching charts. You will see how our region compares to the nation and Virginia and how our differences are what make us a unique region.
The nation and Northern Virginia are transforming demographically. Demographic transformations change a region’s culture. They also greatly impact the services that governments and schools provide and compel these entities to plan for projected future demographic changes. Transformations are occurring nationally with the backbone of these transformations being the growth of racial minorities and immigration to our country and an aging baby boomer population. By the 2030s, natural increase is projected to be small, because births would be offset by a rising number of deaths from the aging baby boomer population. Most of the future population growth from 2030 to 2060 is expected to be from immigration. According to the Census Bureau’s 2017 National Population Projections, it is projected that the nation will become majority-minority in 2045.
Like the nation, over the past couple of decades, Northern Virginia has experienced a major transformation driven by the growth of racial minorities and the foreign born populations. This growth is almost guaranteed to continue given where the nation is projected to head. The increase in racial minorities has been largely the result of increases in Asians and Hispanics. Another big driver of recent demographic shifts worth noting is the region’s economic dependency on the federal government job sector and federal contracting jobs.
Key findings on Northern Virginia include the following, of which many more can be found by navigating the NOVARegion dashboard.
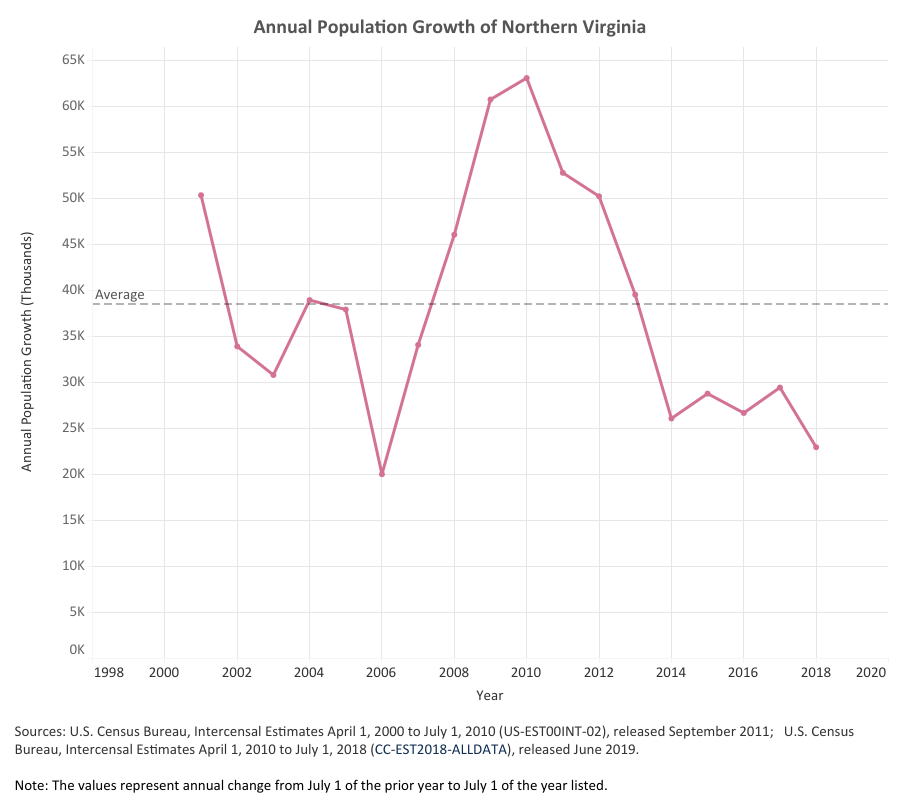
Overall Population Growth: Between 2000 and 2010 the average annual population growth was nearly 42,000. Growth has slowed down since 2010 in Northern Virginia, but it is still large and impactful on the region. The average annual gain since 2010 has been 36,000.
Federal Reliance: Aside from there being low population growth from 2005 to 2006, the annual growth of the last five years has been the lowest since 2000. The Washington metropolitan region has an economy that is heavily dependent on the federal government. This is very apparent with the slowdown in population growth that has occurred since 2013. In 2013 federal sequestration began. Slower population growth since 2013 has paralleled a drop in federal employment in the Washington metropolitan region for the same period.
Minority-Majority Transition: From 2000 to 2010, 88 percent of the net population increase in Northern Virginia came from increases in minorities. From 2010 to 2018, it was 90 percent. Minorities as a share of the total Northern Virginia population has been steadily trending up. Back in 2000 the region was 34.6% minority. The region is now nearly majority minority, at 49.4% minority population. I will not be surprised if the region bypasses 50% by 2020, which we will have to wait and see with the big and very important 2020 Census.

Foreign Born Transformation
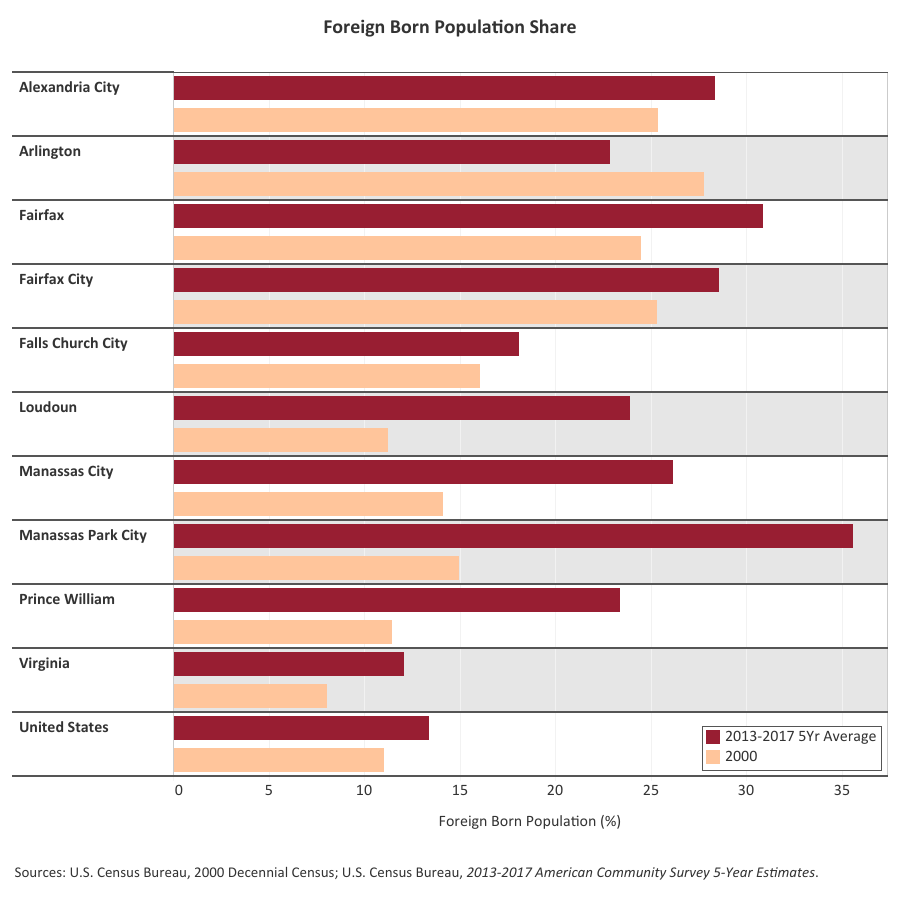
The majority of population growth and the growth in the foreign born population since 2000 has occurred in the outer-core jurisdictions of Loudoun, Prince William, Manassas, and Manassas Park.
Northern Virginia has some of the highest foreign born populations in the U.S Out of all 3,141 jurisdictions in the USA, all Northern Virginia’s jurisdictions have a foreign born population percentage that are ranked #135 or higher. The region’s highest ranked are Manassas Park City (10th) and Fairfax (25th), both of which have a greater foreign born population share than New York County, New York (Manhattan) (35th). Back in 2000, all jurisdictions in Northern Virginia had a foreign born population share that was less than Manhattan. These high ranks of the region’s jurisdictions are indicative of a transforming region and the very diverse population of Northern Virginia and the DC metropolitan area.


